Introduction - BDSS
The Brown Dwarf Spectroscopic Survey (BDSS), established in 1998 by Dr. Ian McLean in collaboration with Dr. J. Davy Kirkpatrick at IPAC, is designed to study near-infrared moderate-to-high resolution spectra for a large sample of low-mass stars and sub-stellar mass objects in the M and newly defined L and T dwarf classes.
The BDSS was initiated following the successful first light commissioning of the Keck-II Near-Infrared Spectrometer (NIRSPEC) in April 1999. The goals of the BDSS are:
- Obtain a uniform set of moderate resolution (R~2,000) NIR spectra for a large sample of very low-mass stars and brown dwarfs to examine general spectral properties and facilitate comparisons with theoretical spectral energy distributions;
- Obtain a set of high resolution spectra (R~20,000) for detailed comparison of individual spectral features with model atmospheres; and
- Monitor selected sources for Doppler shifts induced by unresolved binary companions.
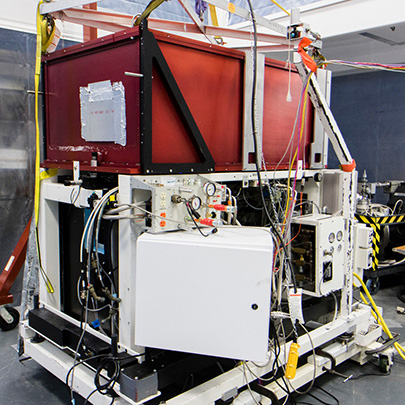
For a description of NIRSPEC see:
McLean et al. 1998, Proc. SPIE, 3354, 566 (PDF)
McLean et al. 2000, Proc. SPIE, 4008, 1048 (PDF)
Description of Low-Resolution Data Products
All data products were obtained with NIRSPEC in its low resolution (R~2000) mode with the 42×0.38 arcsecond (2 pixel) slit in place. Six filters (NIRSPEC-1 through NIRSPEC-6) give overlapping wavelength coverage from 0.96 – 2.31 microns. The table above lists the seven instrumental configurations we have used and their effective wavelength range of importance to the survey. Note: The NIRSPEC-6 is a broad H+K filter centered at 1.925 microns with a bandwidth of 0.75 microns. Since the entire NIRSPEC-6 bandwidth cannot be simultaneously observed on the detector, two configurations, N6a and N6b, are used to obtain the long wavelength half of the H-band and the K-band, respectively. NIRSPEC-5 (essentially H-band) was used only for one observation of the T8 dwarf 2MASS 0415-09.
The table below lists the sample of low mass stars and brown dwarfs included in our survey. The observing strategy for these objects was to obtain a 300s exposure with the source at each of two positions separated by ~20" along the 0.38" slit. Most objects were observed in an ABBA pattern giving total integration time of 20 minutes per grating/filter configuration. For fainter objects (J~16) this procedure was repeated to maintain a signal-to-noise ratio of at least 20:1 per resolution element over the majority of the spectral region observed. Reduction of the spectra was accomplished using REDSPEC, software designed and developed primarily for NIRSPEC data reduction. Data from filters NIRSPEC-3 through NIRSPEC-6 were combined to create a 1.14-2.31 micron composite spectrum. In some cases the shorter wavelength end was extended out to 0.96 microns with the inclusion of data from the NIRSPEC-1 & 2 filters. Composite spectra were flux calibrated (in Flambda units) using 2MASS photometry, following the prescription of McLean et al. (2001). See paper for details concerning the observing strategy and data reduction process.
Data products can be downloaded individually from the table of objects given below or in groups found the next section. Individual data files contain six lines of introductory text followed by two columns of wavelength (microns) in the first and normalized flambda in the second. Composite spectra follow the same prescription except the second column is replaced by flux calibrated data (W m⁻² μm⁻¹) using 2MASS photometry.
Description of High-Resolution Data Products
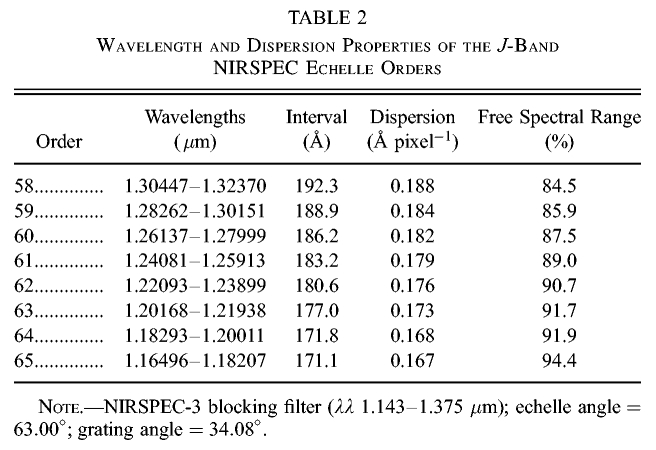
All high-resolution data products were obtained with NIRSPEC in its high-resolution (R~20,000) mode with the 12 arcsecond by 0.432 arcsecond (3 pixel) slit in place except in the case of 2MASS 1507-16, for which the 0.576 arcsecond slit (4 pixels) was used because of poor seeing. The NIRSPEC-3 filter, approximating standard J-band coverage, was used for all observations. The table on the left lists the effective wavelength coverage of each echelle order for the given instrument settings.
The table below lists the sample of low mass stars and brown dwarfs included in our high-resolution survey. The observing strategy for these objects was to obtain a 300-second or 600-second exposure (40 seconds by 3 coadds for Wolf 359 and 360 seconds for 2MASS 0746+20) with the source at each of two positions separated by seven arcseconds along the 12-arcsecond-long slit. Most objects were observed in an ABBA pattern giving total integration time of 20-40 minutes. For fainter objects (J~16) this procedure was repeated to maintain a signal-to-noise ratio of at least 20:1 per resolution element over the majority of the spectral region observed. Reduction of the spectra was accomplished using REDSPEC, software designed and developed primarily for NIRSPEC data reduction. See paper for details concerning the observing strategy and data reduction process.
Data products can be downloaded individually from the table of objects given below or in groups found the next section. Individual data files contain six lines of introductory text followed by two columns of wavelength (microns) in the first and flux (normalized within each order) in the second.
Download Data Products
Low-Resolution Data Archive
Flux Calibrated Archive
High-Resolution Data Archive
Groups — Echelle Orders
Low-Resolution Data Products
| Type | Object Name | RA (2000) | Dec (2000) | J | H | Ks | Coverage | N1 | N2 | N3 | N4 | N6a | N6b | Composite | |||||||
|---|---|---|---|---|---|---|---|---|---|---|---|---|---|---|---|---|---|---|---|---|---|
All coordinates and JHKs photometry are from the 2MASS All-Sky Data Release. Magnitude uncertainties can be obtained from Table 2 of McLean et al. (2003).
Spectral types for M dwarfs based on the classification scheme of: Kirkpatrick, Henry & McCarthy (1991) and Kirkpatrick, Henry, & Simons(1995).
Spectral types for L dwarfs based on the: Kirkpatrick optical classification scheme.
Spectral types for T dwarfs based on the: Burgasser near-infrared classification scheme.
For additional information regarding objects in this archive see Davy Kirkpatrick's L & T Dwarf Archive.
High-Resolution Data Products
| Type | Object Name | RA (2000) | Dec (2000) | J | Itime (s) | Avg SNR | BVC (km/s) | 58 | 59 | 60 | 61 | 62 | 63 | 64 | 65 | PS Plot |
|---|
All coordinates and J-band photometry are from the 2MASS All-Sky Data Release. The above data are published in McLean et al. (2007) and Rice et al. (2010).
Itime is the total integration time in seconds. The average SNR is the average per resolution element accross all reduced orders. BVC is the applied barycentric velocity correction in kilometers per second.
Notes: Objects missing order 60 lack arc lamp lines for wavelength calibration. Other orders are calibrated with OH night sky lines.
Grayed out objects have been reduced and are currently available by request only.